.png)

Towards an Energy Counter-Shock?
Write by Alexis Gléron and Amélie Janin, may 2024
You have likely noticed that energy prices are slowly but steadily decreasing. Will this drop continue? Will prices return to their pre-crisis levels, or even fall below? And will this trend last?
This article will briefly respond these complex questions.
We are on a market trajectory where a return to pre-crisis levels (40-60 euros/MWh) seems likely. But what factors are at play?
Increase in LNG Export Capacity and High Storage Levels.

Additionally, a new regulation on gas storage was implemented in 2022. It stipulates that underground gas storage facilities in Member States must be filled to at least 80% of their capacity before winter 2022/2023, and then to 90% before subsequent winters. At the global level, the European Union aims for a collective filling rate of 85% of the total capacity of underground gas storage in 2022. For Member States without storage facilities on their territory, the regulation requires them to store 15% of their annual gas consumption in facilities located in other Member States. All these elements led to gas storage levels at the end of 2023 being higher than the average of the past five years.
As a result, gas prices dropped significantly, stabilizing around €40/MWh on average over the course of 2023.
The drop in gas prices also played a major role in reducing electricity prices in wholesale markets in France. Even though electricity production from fossil fuels remained low, electricity prices in France are still very sensitive to changes in gas prices, partly due to France’s central position in the interconnected European system and the price-setting mechanism on the markets.
The year 2023 was marked by record production for both wind power, with 50.7 TWh, and solar power, with 21.5 TWh. These energy sources accounted nearly 15% of total electricity production, contributing to supply security and the increase in low-carbon electricity supply in France and neighboring countries through exchanges. The installed capacity of solar farms and offshore wind turbines saw strong growth in 2023. Hydroelectric production, which reached 58.8 TWh, maintained its position as the second-largest source of electricity in France. This recovery compared to 2022 is largely due to increased rainfall, which helped maintain high storage levels. The increase in installed capacity and the good load factor resulting from favorable weather conditions also contributed to this improvement in renewable energy production.
According to the energy mix scenarios developed by RTE for 2035, installed capacities vary depending on the projections. For solar power, installed capacity in 2023 is 17.2 GW and is expected to reach between 55 GW and 90 GW, depending on the scenario, which represents a three- to five-fold increase in 2023 production. For wind power, both onshore and offshore, installed capacity in 2023 is 22 GW and is expected to reach between 30 GW and 39 GW by 2035, an increase of between 36% and 77%. Finally, for hydropower, forecasts range between 27 GW and 28 GW, representing an increase of around 5%.

Can prices fall to levels lower than those before the crisis?
The question is difficult and depends on nuclear availability in France. Although nuclear production has rebounded since its low point in 2022, it has not returned to pre-crisis levels, yet. In 2023, production reached 320.4 TWh, an increase of 41.5 TWh compared to 2022. However, this figure remains below the average of 394.7 TWh recorded between 2014 and 2019. Moreover, several uncertainties lie ahead regarding nuclear availability in the coming years. Indeed, France's nuclear fleet is aging, and the question of extending its lifespan beyond the next decade remains open.
Several factors could lead to an increase in nuclear production and availability: the launch of the Flamanville EPR, the completion of the Grand Carénage program, increased operational efficiency, and shorter maintenance times. If all these factors come together, electricity prices are likely to fall below their pre-crisis levels. In fact, nuclear production equivalent to 400 TWh, combined with increased renewable energy production, would exceed the current subdued demand for electricity.
Let’s consider a scenario: Improved nuclear availability; what will happen?
Let’s imagine a scenario where the availability of nuclear power plants in France improves significantly. Thanks to successful and quicker maintenance operations, as well as favorable weather conditions (with no plant shutdowns due to heatwaves), the nuclear fleet reaches its full potential. In this scenario, we won’t consider future SMRs or new EPR reactors, but instead, return to nuclear production levels comparable to pre-crisis, around 400 TWh.
Using 2023 figures for electricity consumption and production in France, this level of production would generate a surplus of 118.6 TWh. This means that France would become a significant electricity exporter, as its domestic energy needs would be fully met.
However, this situation could create a dilemma. If neighboring countries do not need large quantities of imported electricity because they are already covering their own needs, this surplus production in France could lead to a drop in electricity prices. As a result, EDF, the main electricity producer in France, might not find it beneficial to further improve its efficiency, as an oversupply would drive down market revenues.

Let’s consider a scenario: Improved nuclear availability; what will happen?
Let’s imagine a scenario where the availability of nuclear power plants in France improves significantly. Thanks to successful and quicker maintenance operations, as well as favorable weather conditions (with no plant shutdowns due to heatwaves), the nuclear fleet reaches its full potential. In this scenario, we won’t consider future SMRs or new EPR reactors, but instead, return to nuclear production levels comparable to pre-crisis, around 400 TWh.
Using 2023 figures for electricity consumption and production in France, this level of production would generate a surplus of 118.6 TWh. This means that France would become a significant electricity exporter, as its domestic energy needs would be fully met.
However, this situation could create a dilemma. If neighboring countries do not need large quantities of imported electricity because they are already covering their own needs, this surplus production in France could lead to a drop in electricity prices. As a result, EDF, the main electricity producer in France, might not find it beneficial to further improve its efficiency, as an oversupply would drive down market revenues.
Quel rémunération est-elle possible avec une ACC?
Let’s imagine a scenario where the availability of nuclear power plants in France improves significantly. Thanks to successful and quicker maintenance operations, as well as favorable weather conditions (with no plant shutdowns due to heatwaves), the nuclear fleet reaches its full potential. In this scenario, we won’t consider future SMRs or new EPR reactors, but instead, return to nuclear production levels comparable to pre-crisis, around 400 TWh.
Using 2023 figures for electricity consumption and production in France, this level of production would generate a surplus of 118.6 TWh. This means that France would become a significant electricity exporter, as its domestic energy needs would be fully met.
However, this situation could create a dilemma. If neighboring countries do not need large quantities of imported electricity because they are already covering their own needs, this surplus production in France could lead to a drop in electricity prices. As a result, EDF, the main electricity producer in France, might not find it beneficial to further improve its efficiency, as an oversupply would drive down market revenues.


Schéma fonctionnement ACC avec surplus au PRE+

Exemple de valorisation de surplus de l'ACC avec une rémunération au PRE+
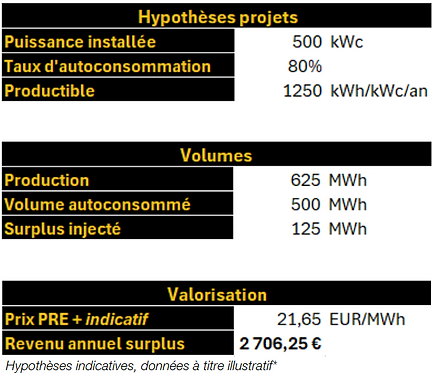
Avec l’offre Easy ACC
-
pas de prévisions de livraison à transmettre
-
pas d’accès marché à gérer
-
pas de pilotage opérationnel complexe
-
un revenu simple sur le surplus injecté
revenu annuel surplus
2706,25 €/an*
ACC Spot - L'autoconsommation collective avec une rémunération au day-ahead

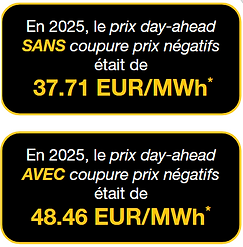

Fonctionnement d'une ACC avec surplus vendus au Spot
Lorsque vous combinez le revenu de l’autoconsommation collective (ACC) avec celui du marché spot, une nouvelle étape est nécessaire par rapport au modèle de rémunération PRE+.
Étape ex-ante : définir une répartition avec Augmented Energy Avant le début de la période (ex-ante), vous devez déterminer une répartition prévisionnelle entre :
-
les volumes livrés aux consommateurs de l’ACC,
-
les volumes destinés à la vente sur le marché spot.
Cette clé permet d’anticiper les volumes non couverts par l’ACC, qui seront donc valorisés au prix spot.
Recommandation : calculé des volumes "quasi-certains" livrés dans le cadre de l’ACC. Cela permet de limiter les volumes d'écart en cas de fluctuations de la consommation. Il est donc conseillé de calibrer l’ACC sur le « talon » de consommation des clients (consommation minimale et constante).Dans ce type de modèle, il est préférable d’avoir des boucles déséquilibrées en faveur de la consommation (légèrement surdimensionnée par rapport à la production).
→ Foisonnement & boucle légèrement moins déséquilibrée
Y a-t-il un risque, et comment l’éviter ?
Imaginons, vous avez effectué votre répartition ACC/Marché ex-ante, cependant, la consommation réelle des membres de votre ACC a été plus faible que prévu.
Si, en fin de période, la consommation réelle des membres de l’ACC est inférieure à la production affectée à l’ACC, cela peut créer un excédent non consommé qui sera valorisé au PRE+. Si à l'inverse la consommation réelle des membres de l’ACC est supérieure à la production affectée à l’ACC, vous devrez “racheter” ce volume qui a été vendus au prix spot aux prix des écarts négatifs.
Exemple chiffrés : Impact d'un écart de consommation d'ACC sur le revenu du producteur
1) La consommation ACC réelle est inférieur au programme déclaré en J-1
L'écart est valorisé au PRE+ ( et non au prix ACC contractuel)


*Hypothèses indicatives, données à titres illustratives

Cet écart de prévision est bénéfique pour le producteur si le PRE+ est supérieure au revenu ACC.
Vous aviez prévu que les membres de votre ACC consommeraient 0.856MWh. Cependant, ils ont finalement consommé 0.656 MWh. Les 0.2 MWh restants n’ont pas pu être vendus sur le marché day-ahead, car la vente sur le spot se fait ex-ante. Ces 0.2MWh sont donc vendus au prix des écarts.
2) La consommation ACC réalisée est supérieur au programme déclaré
L’écart est valorisé au PRE-

*Hypothèses indicatives, données à titres illustratives


→ Lorsque PRE- < revenu ACC, c’est une perte d’opportunité.
→ Lorsque PRE- > revenu ACC, perte de revenu
Vous aviez prévu que les membres de votre ACC consommeraient 0.856 MWh. Cependant, ils ont finalement consommé 1.056 MWh. Si vous les livrez avec l’ACC, il vous manquera donc 0.2 MWh.Comme vous ne pouvez pas « réaffecter » les volumes du marché spot ex-post (ils ont déjà été vendus), vous êtes obligés de racheter les 0.2 MWh manquants au prix des écarts négatifs (PRE-). Cela représente un surcoût si le PRE- est plus élevé que le prix spot sur le même pas de temps.
ACC M0 - Combinaison des revenus ACC et M0 : le mécanisme en pratique
Lorsqu’un producteur solaire combine une ACC avec la valorisation de son surplus sur le marché, deux flux de revenus coexistent en parallèle :
-
Le revenu ACC : un prix fixe facturé aux consommateurs participant à l’opération d’autoconsommation collective (par exemple 70 €/MWh)
-
Le revenu marché : la vente de l’électricité injectée au réseau hors volumes ACC, valorisée au prix de référence M0 publié mensuellement par la CRE
Comment fonctionne la ventilation avec Augmented Energy ?
Dans le cadre du contrat avec Augmented Energy, le mécanisme de séparation entre les deux revenus fonctionne de la façon suivante :
Étape 1 — Achat de la totalité de la production au M0 Augmented Energy achète l’intégralité de l’électricité injectée par les Sites d’Injection (y compris les volumes qui vont alimenter les consommateurs ACC) au prix de référence M0.
Étape 2 — Retranchement des volumes ACC valorisés au Day-Ahead Augmented Energy déduit ensuite des sommes versées les volumes correspondant au Programme de Livraison aux ACC, valorisés aux prix quart-horaires de l’Enchère Day-Ahead (marché spot, plateforme Nord Pool). Si le Programme de Livraison aux ACC suit bien le profil de la production solaire, son prix est égal au prix M0 et les deux termes se neutralisent .
Le revenu versé par Augmented Energy au producteur est donc :
Revenu Augmented = Production totale × M0 − Volumes ACC (programme) × Prix Day-Ahead
Étape 3 — Revenu ACC complémentaire Le producteur perçoit séparément , le prix fixe ACC sur les volumes effectivement consommés :
Revenu ACC = Volumes consommés × Prix fixe ACC
Revenu total (hors écarts) ≈ Production totale × M0 + Volumes ACC × (Prix fixe ACC − Prix Day-Ahead)
La gestion des écarts ACC
Le Programme de Livraison aux ACC, c’est-à-dire la prévision quart-horaire des volumes livrés aux consommateurs, doit être transmis à Augmented Energy. Toute modification doit être communiquée dès que possible.
Lorsque la consommation effective des ACC s’écarte du programme transmis, un mécanisme de règlement des écarts s’applique automatiquement :

Ces prix d’écart publiés par RTE reflètent le coût de rééquilibrage du réseau. Ils peuvent s’écarter significativement du marché spot, à la hausse comme à la baisse. La précision du Programme de Livraison est donc un levier de rentabilité important.
Exemple chiffré - Cas sans écart


L' ensemble de nos solutions pour les ACC
